Note
Click here to download the full example code
Subplots
When you’re preparing a figure for a paper, there will often be times when you’ll need to put many individual plots into one large figure, and label them ‘abcd’. These individual plots are called subplots.
There are two main ways to handle subplots in GMT:
Use
pygmt.Figure.shift_originto manually move each individual plot to the right position.Use
pygmt.Figure.subplotto define the layout of the subplots.
The first method is easier to use and should handle simple cases involving a
couple of subplots. For more advanced subplot layouts however, we recommend the
use of pygmt.Figure.subplot which offers finer grained control, and
this is what the tutorial below will cover.
Let’s start by importing the PyGMT library and initiating a figure.
import pygmt

fig = pygmt.Figure()
Define subplot layout
The fig.subplot(directive="begin") command is used to setup the layout,
size, and other attributes of the figure. It divides the whole canvas into
regular grid areas with n rows and m columns. Each grid area can contain an
individual subplot. For example:
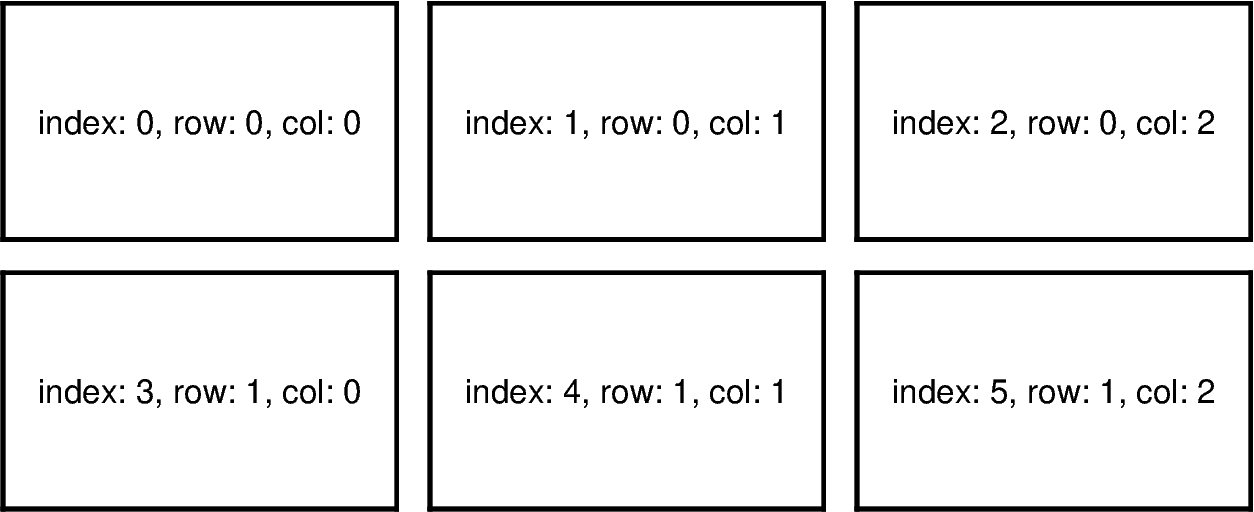
fig.subplot(directive="begin", row=2, col=3, dimensions="s5c/3c", frame="lrtb")
will define our figure to have a 2 row and 3 column grid layout.
dimensions="s5c/3c" specifies that each ‘s’ubplot will have a width of
5cm and height of 3cm. Alternatively, you can set dimensions="f15c/6c" to
define the overall size of the ‘f’igure to be 15cm wide by 6cm high. Using
frame="lrtb" allows us to customize the map frame for all subplots. The
figure layout will look like the following:
Out:
<IPython.core.display.Image object>
The fig.subplot(directive="set") command activates a specified subplot,
and all subsequent plotting commands will take place in that subplot. In
order to specify a subplot, you will need to know the identifier for each
subplot. This can be done by setting the row and col arguments.
Note
The row and column numbering starts from 0. So for a subplot layout with N rows and M columns, row numbers will go from 0 to N-1, and column numbers will go from 0 to M-1.
For example, to activate the subplot on the top right corner (index: 2) so that all subsequent plotting commands happen there, you can use the following command:
fig.subplot(directive="set", row=0, col=2)
Finally, remember to use fig.subplot(directive="end") to exit the subplot
mode.
fig.subplot(directive="end")
Total running time of the script: ( 0 minutes 0.567 seconds)